
min read
Business intelligence (BI) systems and solutions have long been a valuable tool used by companies to organize and analyze information related to their markets and operations. The amount of data available to companies has grown exponentially in the past decade, which has increased demand for BI solutions that manage and make sense of this mountain of information. A quantum leap forward in the evolution of BI is the ability to link, analyze and display information based on a shared geographic component, such as postcodes. So-called “location-enhanced” BI allows users to extract insights from the spatial relationships contained in their data, an approach that often reveals startling new perspectives that would not otherwise be apparent in conventional tabular form.
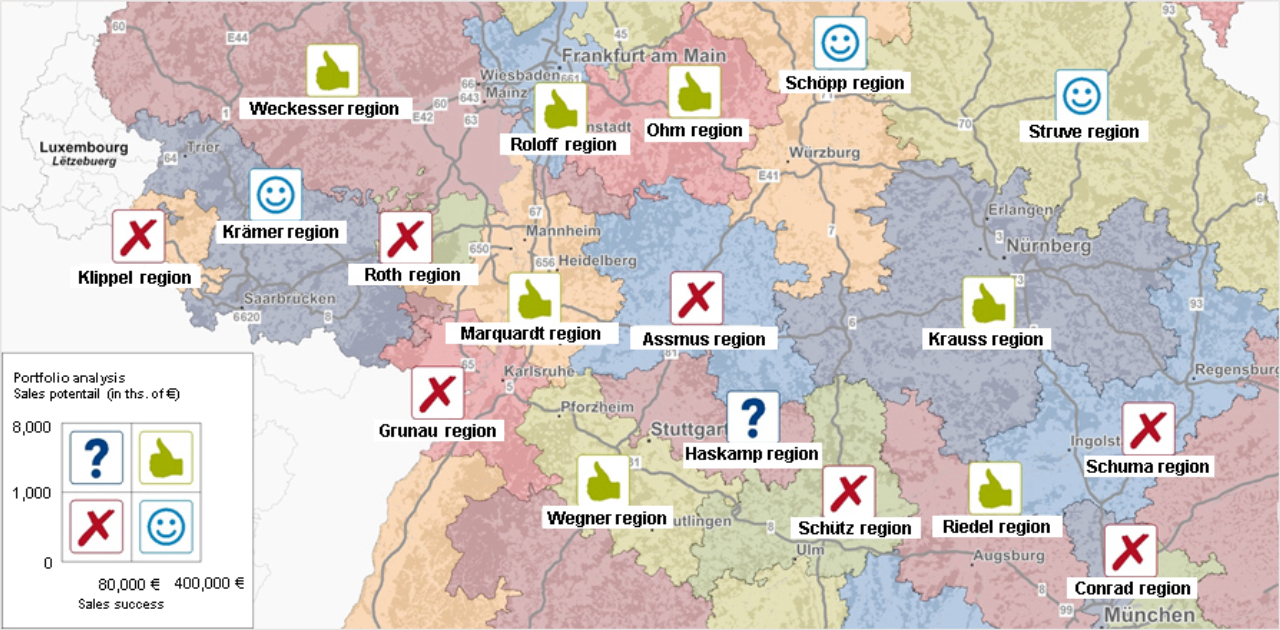
Boosting performance by answering the “where” questions
Good mapping data in BI makes it possible to successfully and eloquently answer the many “where” questions faced by companies of all sizes and types. For example, where are my customers located, where is my turnover greatest¸ where are gaps in my coverage, where am I failing to tap existing market potential, where are sales force staff meeting their targets, where are ideal new distribution sites to improve my logistics network, and so on. These “where” questions are truly endless.
Integrated boundary data lets BI users answer these “where” questions by visualizing information on digital maps. One advantage of this approach is that it often reveals answers and solutions to issues not yet on the radar. For example, a retailer might map its customer and turnover distribution only to realize that there are significant gaps or cannibalization effects in its market. Once this is seen on a map, both the problem and solution become clear.
Some companies slow to embrace location-enhanced BI
Many companies across all industries have recognized the benefits of using BI with integrated cartographic data to support geographic analyses and visualizations. And there is a growing trend toward interface-friendly, dashboard-enhanced BI solutions that offer a range of metrics for extracting insights from location data. An increasing number of providers are offering BI systems or add-ons that have the capacity to link, analyze and display information geographically.
But not all companies have embraced location-enhanced BI. Some remain unconvinced that the benefits are worth the investment.
One misconception is that maps in BI are simply an aesthetic feature. This view neglects two essential points. First, digital maps are not mere geographic illustrations, but rather powerful data repositories with which diverse types of data can be stored, linked, analyzed, compared and then finally displayed cartographically. So the illustrative value of digital maps or geodata is only one of their functions.
Second, displaying spatial relationships cartographically is one of the primary ways that companies gain insight into their performance and operations. Maps reveal and bring into sharp focus geographic relationships that otherwise remain buried in the numbers. For example, the simple act of displaying the distribution of one’s customers and retail sites can immediately reveal coverage gaps that would otherwise go undetected.
Greater insights through strategic simplification
One of the main ways our brains process information is through spatial perception. Visualizing data and the results of analyses on maps often allows us to grasp trends and relationships that we wouldn’t detect in any other way.
But a crucial part of recognizing these insights is displaying only a limited number of metrics on a map at a given time. This makes it possible to then actually discern how certain variables interrelate and track across a given market area. These days the challenge is no longer acquiring data, but rather filtering out background noise so the crucial trends and relationships can come into sharp focus.
Geographic analyses no less important in the digital age
Customers increasingly interact with brands and products through digital channels. But the value of geographically analyzing this data is just as if not more important, because these online interactions still have a geographic footprint, whether IP addresses of static log-in sites or the various locations where customers interface with their smartphones and mobile devices as part of the purchase journey.
Good-quality digital maps integrated into a BI system or solution are the best way to map these interactions and extract valuable insights from them. Additional benefit can be gained by importing relevant market data such as demographic information or purchasing power for a company’s product line. The resulting insights allow businesses to adjust to market realities more quickly and seize opportunities before the competition.
For more information, contact Friedlind Dürr, Head of Partner Development, at friedlind.duerr@gfk.com.
Browse GfK’s global offering of BI-compatible maps at www.gfk-geomarketing.com/en/digital_maps/availability_by_system/maps_for_bi.html. Or learn more about GfK’s market data at http://www.gfk-geomarketing.com/en/market_data/available_market_data.html.