
min read
Now in its 34th year, our recently released 2014 Ownership and Trend Report[1] not only provides subscribers with long-term trends, but also insights into contemporary media business issues. A key issue of recent concern is cord-cutting – how prevalent is it, and what do cord-cutter homes look like? With a fully representative and projectable sample, we can supply a highly reliable look.
From our trend data, we see that while the proportion of TV homes that have cut the cord at their current residence is still small – 7% of TV homes, or roughly 8 million homes – the increase seen in this proportion between 2011 and 2014 is indeed statistically significant. If this trend continues, we could expect that over a tenth of TV homes will be classified as cord-cutter homes by the time we reach 2020.
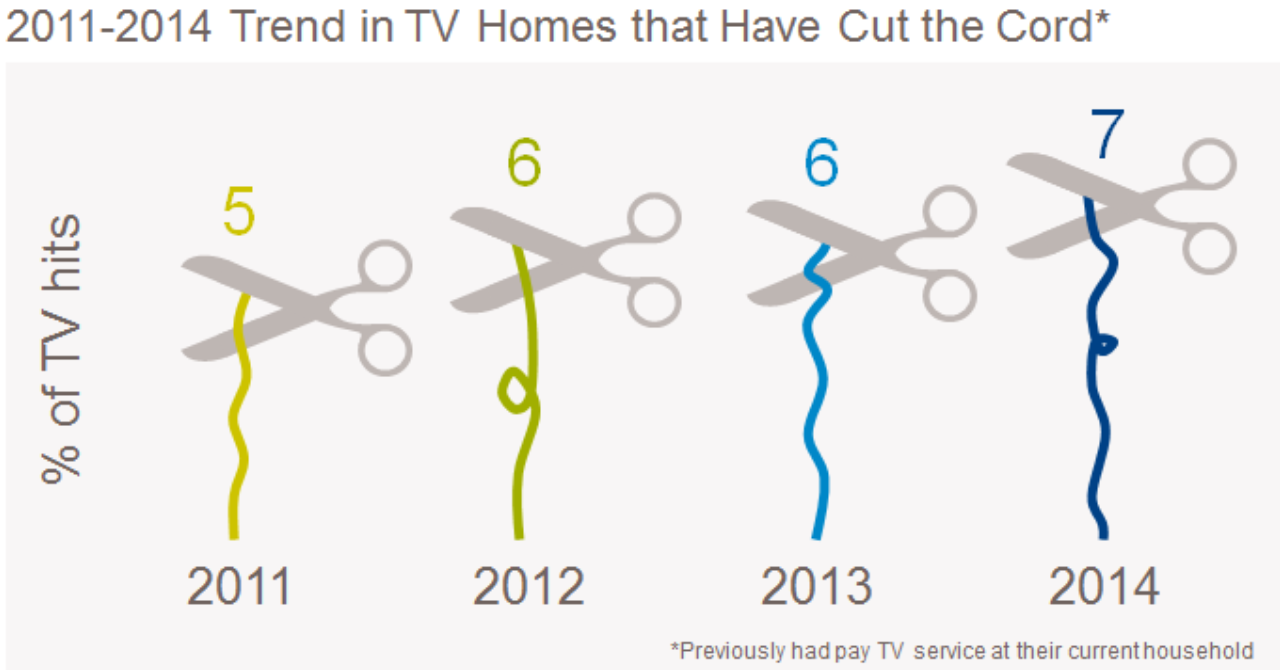
Why have people been cutting the cord? The answer has been very consistent for the last few years – economics. Overall budget cutting and value-for-cost have by far led the list of reasons. Alternative viewing – online or otherwise – is cited much less often. One interesting finding is that we saw mentions of “can watch what we want over-the-air” double in the past year, indicating a growing awareness of digital broadcast options – what is old is new again.
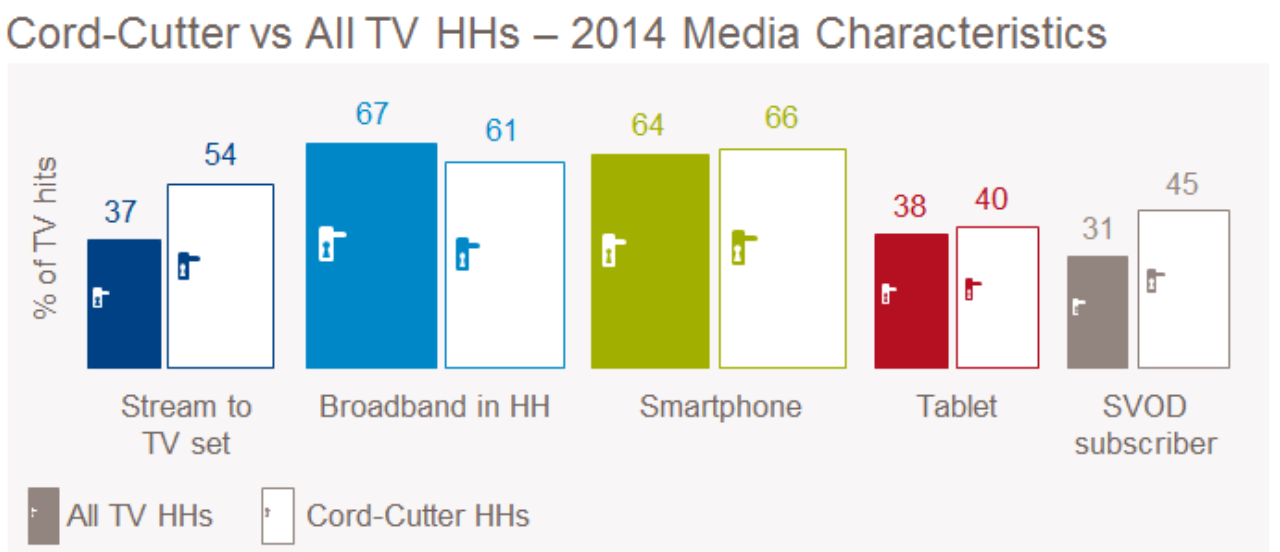
Cord-cutting TV homes look pretty similar to all TV homes, with some notable exceptions. In terms of media characteristics, a broad look tells us that they are much more likely to stream OTT content for viewing on TV sets and, complementing that, they are also much more likely to be SVOD subscribers. But in terms of most devices/services - such as having broadband, smartphones, or tablets - they are similar to TV homes overall.
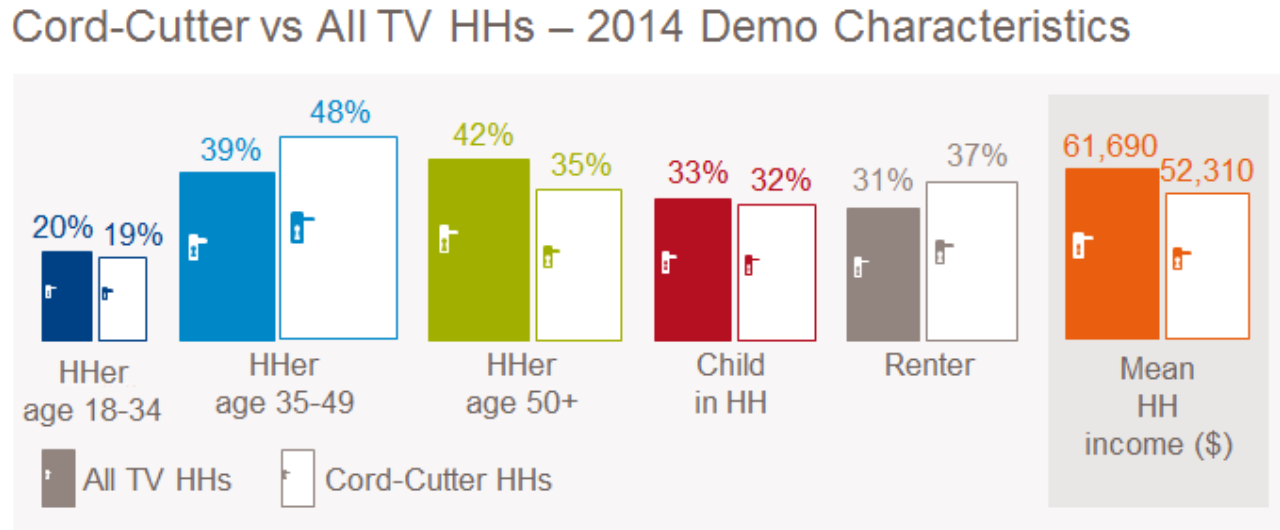
Demographically, cord-cutting TV homes are again broadly similar to all TV homes, with most differences directional rather than significant. Contrary to popular belief, cord-cutting households are no more likely to have young adult householders than TV households overall. They are also just as likely to have children as all TV homes.
However, cord-cutter TV homes are more likely to be “mid-aged”, with a householder age 35-49. And, directionally, cord-cutter homes are somewhat more likely to be renters and have a 15 percent lower mean income – perhaps indicative of the economic reasons for cutting the cord.
These topline but informative insights seem to indicate that while the cord-cutting phenomenon is among a small group of TV homes, these homes are not easily profiled by characteristics like age, device, or income; they are a niche but they are relatively mainstream niche. Yes, they are more likely to be using OTT services, but this goes hand-in-hand with their need for alternative sources of content.
The bottom line is that the diversity seen in cord-cutting homes means that media stakeholders need to have a variety of options to address this issue – there is not a single magic bullet that will slay the cord-cutting beast.
David Tice is Senior Vice President on the Brand and Customer Experience team at GfK. He can be reached at david.tice@gfk.com.
[1] 2014 Ownership and Trend Report, published June 2014 as part of The Home Technology Monitor™ service. The study used a sample of 3,000 US households, including representative levels of off-line, cell-phone-only, and Spanish-speaking homes.