Africa’s middle class citizens are the markers for future tech opportunities in the continent.
The growing role of Africa in international trade has been well documented and the figures widely circulated: the emerging markets’ scramble for African commodities has brought billions of dollars of investment; in the last ten years foreign direct investment in Africa has surpassed aid; inter-African trade is on the rise[1]; Africa’s population makes up around a billion consumers, and that population is growing [2]. With this backdrop, technology trends in Africa have been fascinating to follow with the growth of mobile phone usage and mobile broadband, and hugely successful mobile payment sectors.
In more recent years businesses targeting consumers have become increasingly aware that not all Africans can be treated as a single segment. One of the world’s largest fast-moving consumer goods (FMCG) companies, Unilever, has expressed the need for this change by admitting that companies have patronized the African consumer for too long. The result of this realization has been the production of a myriad of segmentations and profiling, championing the range of trend setters, from adolescent girls to the so-called ‘black diamonds’[3] - a group generally comprising members of the elite and with a taste for luxury and branded goods.
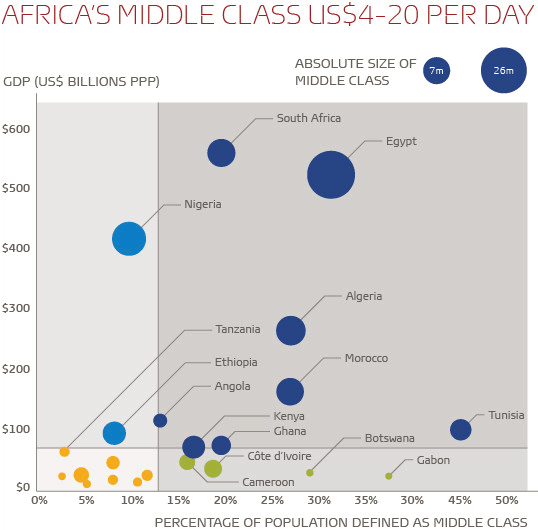
However, companies need to know where to invest before looking at deeper segmentations of consumers. And a tendency to apply segmentations based on qualitative data across the whole continent must be questioned. While the super-rich ‘black diamonds’ have indeed been a real opportunity for high margin luxury goods, they do not necessarily mark a great opportunity for FMCG essentials or lower-end technologies. As we expect even smartphones to fall below the US$100 mark in the next few years, a wider view of consumers has to be taken. When the biggest success stories in African innovation have been products and services aimed at the middle class, such as mobile money transfers, it seems that it is this group which is the marker for opportunity, as shown in the chart below.

This quadrant chart looks at the different opportunities for middle class demand by setting the relative size of the middle class within each country against the country’s national GDP, the size of its economy. The size of the bubble reflects the actual population size of the middle class in absolute terms, i.e. 45% of the population in Tunisia is middle class, but due to population size differences, there is a slightly smaller middle class population than that of Ethiopia, where less than 10% of the population is middle class.
In order to make fair comparisons across countries we have used the African Development Bank’s [4] figures and definition of middle class, based on the “‘lower-middle’ class with per capita consumption levels of US$4-10 per day’”[5] a group that “‘lives above the subsistence level and is able to save and consume non-essential goods”’ and the “‘upper middle class’ with per capita consumption levels of US$10-20 per day”[6] This definition provides a range of middle class expenditure from US$1,500-7,300 at purchasing power parity. While these may be seen as rather low by developed market standards this class is defined by salaried jobs, smaller families, better education and more likely to be in urban areas. Therefore within households and family units there is a realistic ambition and demand for low-end tech.
Using the Chart
The right hand quadrants show larger middle classes as a percentage of their population. As well as suggesting a more mature and diversified economy, a larger middle class can also have positive implications when considering taking a product to the market. Among other things it can help inform the communications and distribution requirements as the target market is more centralized and the touch points are greater.
The upper quadrants contain the larger African economies. Some of these are here as a result of more recent exploitation of natural resources. While GDP alone might disguise a lack of diversification or existing infrastructure in an economy, it does show the possibility of development in the future. It is likely, for example, that Nigeria will move into the upper right hand quadrant as mineral wealth filters through the economy.
What the chart tells us
This chart does not take into account wider issues such as the cost of doing business (bureaucracy, corruption and security) but it does show spending power and the economic context of that spending power of middle class consumers in African markets. It is perhaps not surprising that South Africa and Egypt show as the greatest opportunities for consumer spending, clearly positioned in the upper right hand quadrant, or that Nigeria is on the cusp of joining these markets. Looking at the absolute numbers does throw light on the relative strengths of these markets. Time will tell as these economies take their different paths.
[1] Mlachila and Takebe (2011) FDI from BRICs to LICs: Emerging Growth Driver?, [Online], Available: http://www.imf.org/external/pubs/cat/longres.aspx?sk=25100.0 [5 Feb 2013].
[2] The Organisation for Economic Co-operation and Development (2013) [Online], Available: http://www.oecd.org/ [5 Feb 2013].
[3] Stokes, G. (2008) The ‘black diamond’ is here to stay, [Online] Available: http://www.fanews.co.za/article.asp?Front_Page_Features~25,Featured_Story~1147,The_black_diamond_is_here_to_stay~4581 [5 Feb 2013].
[4] African Development Bank Group (2013) [Online], Available: http://www.afdb.org/en/ [5 Feb 2013].
[5] AfDB (2011) The Middle of the Pyramid: Dynamics of the Middle Class in Africa, [Online], Available: http://www.afdb.org/fileadmin/uploads/afdb/Documents/Publications/The%20Middle%20of%20the%20Pyramid_The%20Middle%20of%20the%20Pyramid.pdf [4 Feb 2013].
[6] The database primarily provides sample distributions based on consumption except in instances in which only income measures exist. At lower income levels, the difference between consumption and income is small.
Chart data sources:
Middle class as a % of population - AfDB (2011) The Middle of the Pyramid: Dynamics of the Middle Class in Africa, [Online], Available: http://www.afdb.org/fileadmin/uploads/afdb/Documents/Publications/The%20Middle%20of%20the%20Pyramid_The%20Middle%20of%20the%20Pyramid.pdf [4 Feb 2013].
GDP: GDP at Purchasing Power Parity (PPP) based on estimates for 2011 from – Central Intelligence Agency (2011) CIA World Factbook, [Online] https://www.cia.gov/the-world-factbook/ [4 Feb 2013].
Absolute size of middle class based on World Bank Total Population size: http://data.worldbank.org/indicator/SP.POP.TOTL
